As per disctionary definition, Histogram is a diagram consisting of rectangles whose area is proportional to the frequency of a variable and whose width is equal to the class interval.
To construct a histogram, the first step is to “bin” the range of values—that is, divide the entire range of values into a series of intervals—and then count how many values fall into each interval.
An example is Histogram of heights of people in inches. In the below web page, there is a Height and Weight data of 25000 people:
http://socr.ucla.edu/docs/resources/SOCR_Data/SOCR_Data_Dinov_020108_HeightsWeights.html
import matplotlib.pyplot as plt
import pandas
colnames = ['Height', 'Weight']
data = pandas.read_csv('HeightWeight.csv', names=colnames)
heights=data.Height.tolist()
weights=data.Weight.tolist()
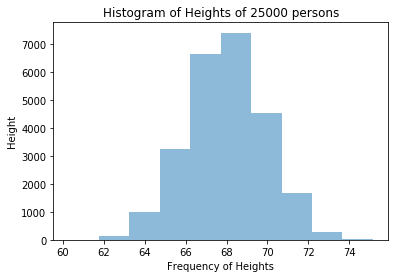
plt.hist(heights, bins=10, alpha=0.5)
plt.title("Histogram of Heights of 25000 people")
plt.ylabel("Height")
plt.xlabel("Frequency of Heights")
plt.show()
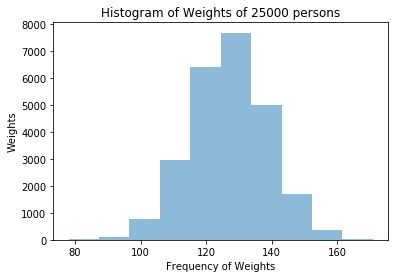
plt.hist(weights, bins=10, alpha=0.5)
plt.title("Histogram of Weights of 25000 people")
plt.ylabel("Weights")
plt.xlabel("Frequency of Weights")
plt.show()
The data is saved as csv file. It contains 2 columns – Height in inches and Weight in lbs.
The csv file content looks like below:
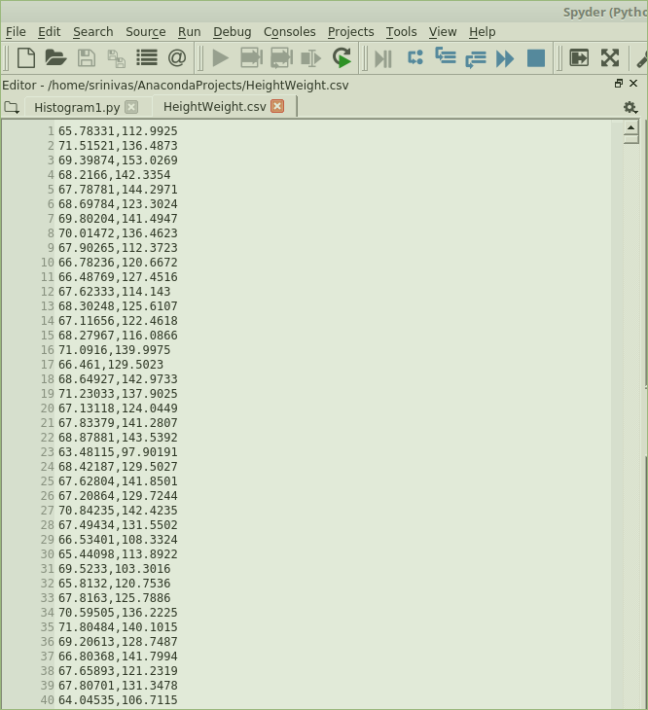
The file is read using pandas read_csv function. This function returns a Dataframe object.
Each column can be converted into a list using tolist() function. Hence we have two lists – one with Heights (of 25000 people) and another with Weights (of 25000 people).
Now, hist function of Matplotlib, we are plotting two seperate histograms for Height and Weight specifying bin as 10.